
Smart Retrofit in the ACT
The PDF Report: Smart Retrofit in the ACT
The Estimator: Smart Retrofit Estimator
Introduction
We have completed an analysis of some of our science team’s retrofit data from the last five years of investigating and helping Canberrans improve the efficiency of their homes. Comparably minor changes to a house can have a major impact on a building's efficiency, saving energy and money for its residents. This is what we call a Smart Retrofit.
The word “renovation” invokes images of construction sites, hoarding fences, and walls being pulled down. It doesn’t suit the somewhat simple changes that our science team recommends to increase energy efficiency, in cost or scale. A Smart Retrofit can cost around $15,000 or even less, without changing windows or doing parts yourself. Even a small increase in efficiency can save you money over time, and the sooner you make the improvements the better. The aim is to lower your energy bills without breaking the bank. Read more about this on our blog: Is Retrofit expensive?
We offer several services to help Canberrans achieve a Smart Retrofit. We use air leakage testing, thermal imaging, and thermal fabric modelling. For this report we have analysed houses that have had both air leakage testing and thermal performance modelling done, a total of 98 real Canberra homes. These two services can be done separately but these cases let us look at the connection between the two. Thermal imaging is extremely useful in finding air gaps but is not useful in comparison or at a large scale.
This report will walk you step by step through our data and what it means to you. By the end you will have a reasonable idea about what a Smart Retrofit is and what can be achieved in a typical Canberra house. We have also produced an estimator that allows you to gauge possible energy and cost savings from retrofitting your own home. It does not indicate real savings but can help contextualise where a house fits with what we have simulated for other Canberran homes.
We, the Light House science team, physically measure a home’s air leakage using our Minneapolis Red Blower Door, see here: The power of sealing air gaps. The blower door tells us how well sealed the house is, and gives an idea of the size of the gaps. We then develop a model that simulates the thermal performance of the house and get estimates of how much heating and cooling the home will need to keep it at comfy temps across a year in Canberra’s harsh climate. This is done using the same software that is used to calculate the energy efficiency rating, EER, of homes. Graph 1 shows how the 98 homes we have analysed performed in both the simulation of their energy efficiency and their air leakage. We then go back into our model and make changes to optimise the home’s performance, starting with draught sealing and working up to more expensive changes. As we optimise the model, we can see the energy saving, and then work out the cost saving. We’ve put all this information together in Graph 2, where we have split the houses based on their starting EER star band. It is important to remember that these numbers are simulated and are not representative of precise savings. However, they do allow us to understand what savings can be expected given certain conditions.
Using Graph 2, we have developed an estimator that can help you gauge the impact of Smart Retrofitting your own home. Here you can choose the size of the home, its existing star rating, and finally, what heating system you use, to find out how much energy and money you could save, based entirely on other Canberra homes.
A Smart Retrofit can save you money, but it’s not the only benefit. Comfort, health, sustainability, and resilience are all improved by increasing the thermal performance of a home.

What is a Smart Retrofit?
A Smart Retrofit is a small-scale renovation aimed to improve the thermal efficiency of a building. It doesn’t mean adding new rooms, changing the homes layout, knocking it down and rebuilding, but instead tries to make the most out of what is already there.
With years of experience and thousands of optimisations of existing buildings, we know that the most effective way of improving an existing buildings efficiency is by draught sealing, adding, or topping up ceiling, wall, and subfloor insulation, upgrading window dressings, upgrading the windows themselves and considering shading options, like blinds or external vegetation. These changes can become expensive, especially window upgrades, but draught sealing and insulation improvements are cheap and pay themselves off in no time at all. You can probably do much of the draught sealing yourself. We recommend engaging a professional for insulation installation.
The earlier you can improve the efficiency of your home, the better. It saves you money for as long as you use the house. It also helps you resist the seemingly constant energy price increase, as you would be using less energy in the first place,
Graph 1: Air Leakage and Thermal Performance
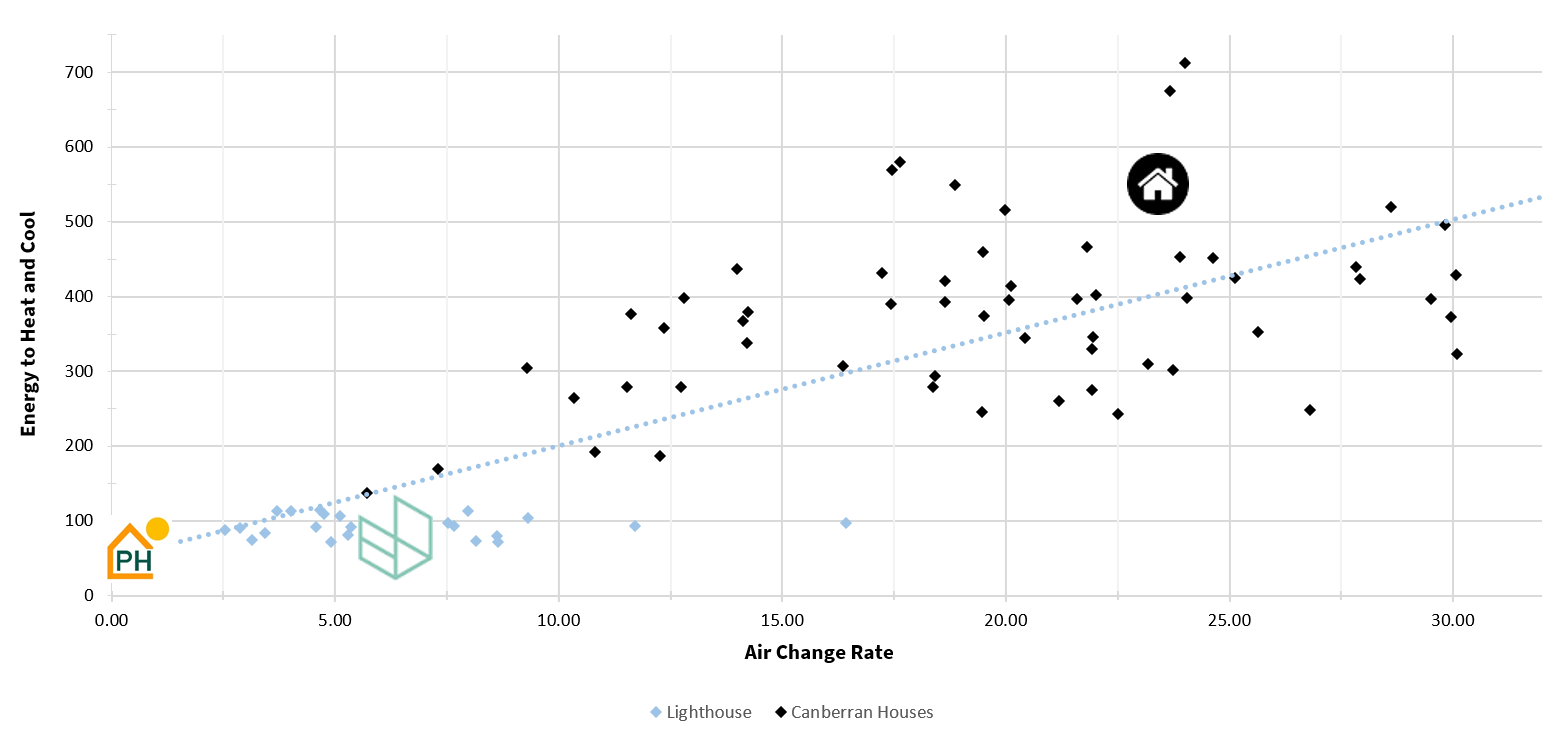
Each diamond on this graph is a real home in Canberra that has had its air leakage tested and has been modelled in NatHERS software, BERS Pro. There is a reasonable spread, but a definite connection between increased air leakage and higher energy demand. The software we use is also currently limited in its ability to include air leakage into its modelling.
There are three icons on the graph that represent different house archetypes in Canberra. The black house circle to the right represents the average Canberra house, in both air leakage and energy load. The black diamonds are houses we’ve assessed through our science work. Our logo, second from the left, shows the average Light House project incorporating new builds and renovations/extensions. The colour matching teal diamonds are our completed projects, modelled and tested. Lastly, the furthest left logo is the PassivHaus standard, 0.6 ACH. Air changes per Hour, ACH, is the international standard for measuring air leakage but doesn’t help you understand much about what is physically happening. Basically, the lower the air changes per hour the better sealed the house is, and the less energy is needed to heat it. It’s worth noting that some non-Light House builds can get great air change rates, but special attention to sealing while building makes a world of difference.
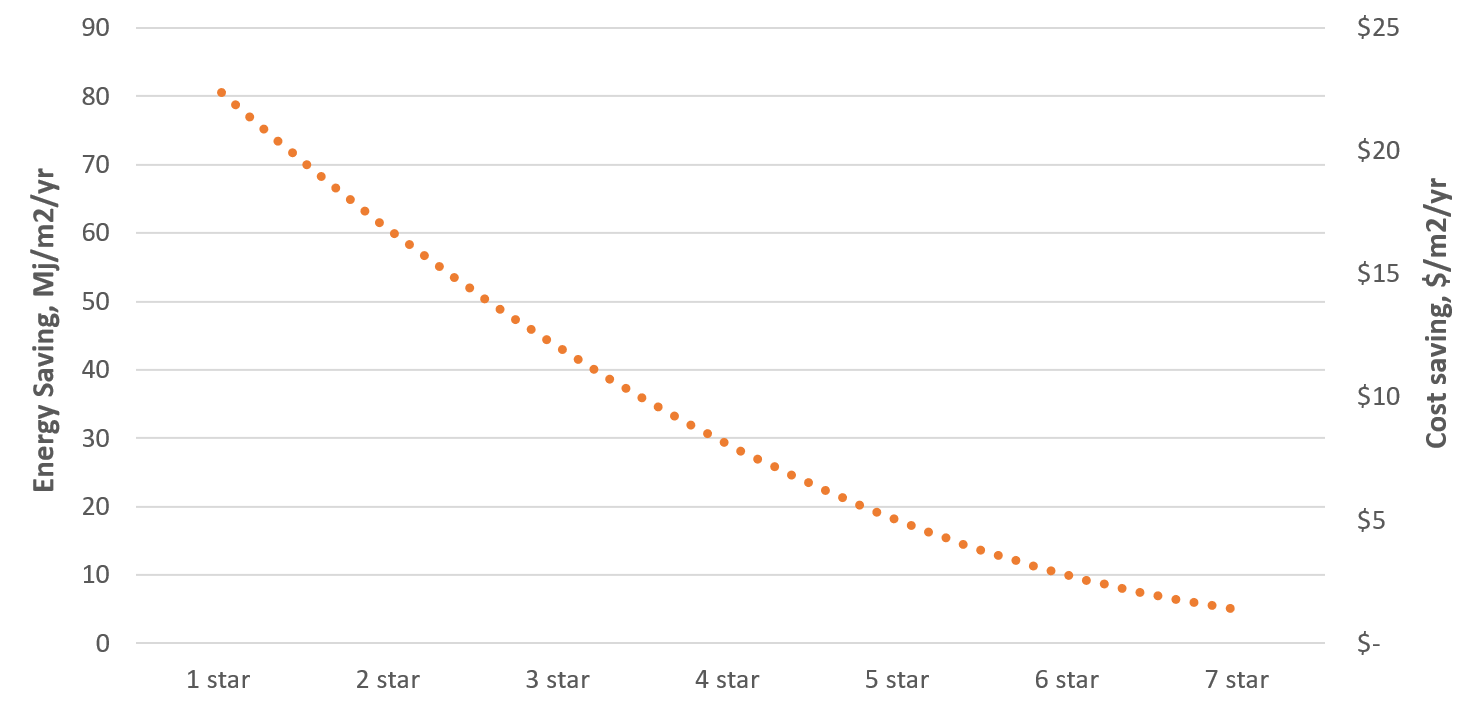
Graph 2: Predicted Savings from Smart Retrofits across Canberra
After modelling an existing house, we provide the homeowner with advice on changes that will increase efficiency. In our report we give a full breakdown of each improvement, their expected cost, and a summary of changes we recommend. These improvements are what we refer to as a Smart Retrofit. It includes, in order of importance: draught sealing, sufficient ceiling and wall insulation, external shading and finally upgrading windows. This is also often the order of cheapest changes! (Meaning you get the best bang for your buck going down this list.)
By optimising the houses in our software, we can see how much homes in each star bracket could save through a Smart Retrofit. Unsurprisingly, the worst performing homes also have the most potential for saving. Graph 2 only includes visits to existing homes and no Light House projects. The cost saving assumes that only electric resistive panels were used to heat the homes. This graph lets us, and you, extrapolate possible savings for other homes in Canberra. Here are some real cases where smart retrofits were implemented: Case Studies.
Smart Retrofit Estimator
Open up the Excel Sheet and have a Go!
You will be shown how to find your home’s current star rating and footprint, if you don’t know them already. Through the data of Graph Two, we found a trend. With a home's current star rating we can accurately estimate how much energy it could save. Once we know how much energy it could save, with home’s size and type of heater we can find out how much money could be saved.
The simulated energy is the pure thermal energy needed to heat the home, but the way we put that thermal energy into the house changes. Each heating system has an efficiency, a coefficient of performance, which determines how much energy is needed to produce that much heat. For example, an air conditioner with a heat pump has a coefficient of 4, an electric resistive panel has a coefficient of 1, and a gas heater has a coefficient of 0.6. Electricity is measured in kilowatt hours, kWh, and everything else in Megajoules, Mj. This is why it is cheaper heating your home with a heat pump than Electric resistive panels. Increasing thermal performance of your home will lower the energy demand, but the cost saving you would get depends on your heating system's efficiency and its fuel type. Almost all Canberra homes use electricity, gas, or wood to for heat. While many homes have a mix of heating options, for our calculator choose your major heater.
This system is far from perfect, and is based on probability, meaning that from our five years of data, we can guess what savings are likely from just a home's heating system, footprint, and current star rating. What we are saying is that your Canberra home is probably going to follow the same trend that we have seen so far. The estimator is also based on simulations that are themselves not perfect, leading to two layers of uncertainty in the final outputs. The final outputs are not indicative of real savings but should only be used to understand the possibilities of increasing energy efficiency in your home.
By Alasdair Taylor

Image Credit: Old Postcard, Canberra aerial photography from the 60's | Riotact (the-riotact.com)